Enterprise brands trust Magnolia DXP


See what's working, right where you work
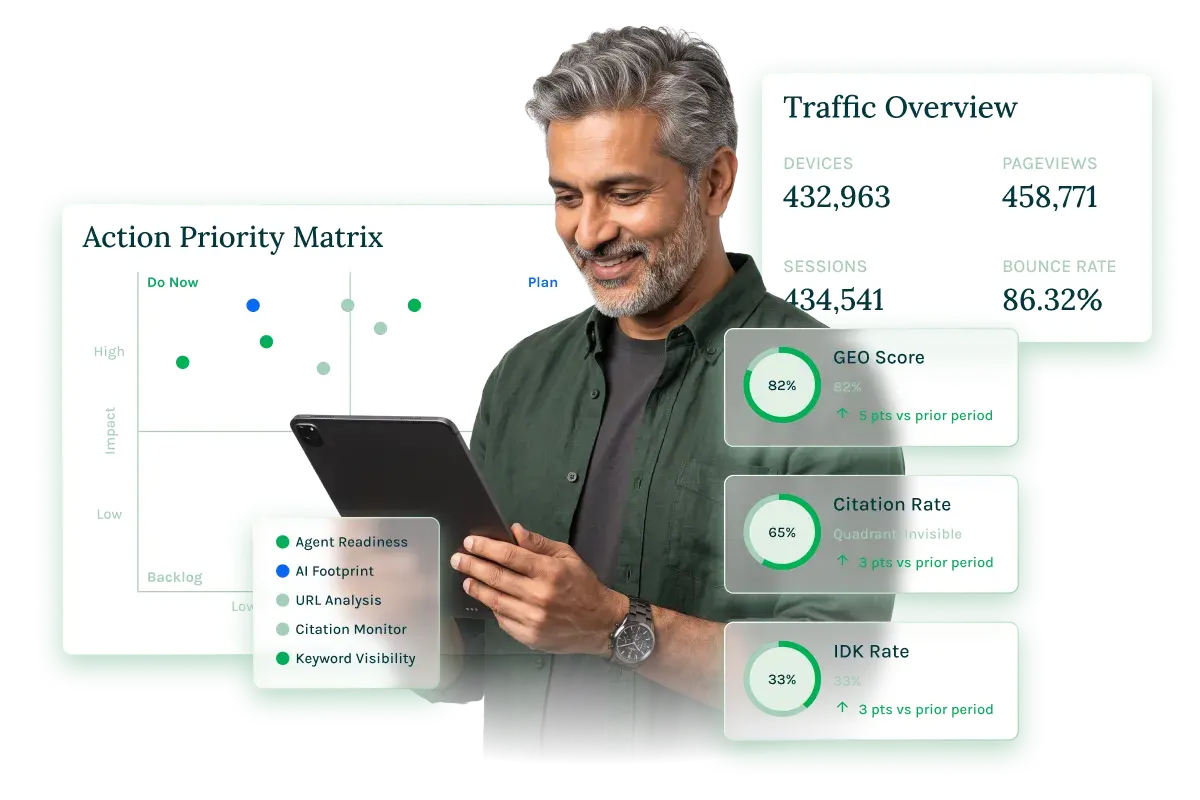
Content performance data usually lives outside your CMS — buried in a BI tool, a spreadsheet, or someone else's report. Magnolia DXP brings it back into the workspace your team already uses, connecting your analytics, search, and behavioral tools into one visual layer built for content decisions.
NATIVE VISUALIZATION
See every number, without leaving your content.
Analyze performance data right where you write and publish. Connect your tools once — dashboards respect your existing permissions.
- Built in from day one: Content health, page counts, and outdated content — no setup required.
- Connect what you already use: Bring in Google Analytics 4, Search Console, and BigQuery, alongside ai12z and Insightech, into one view.
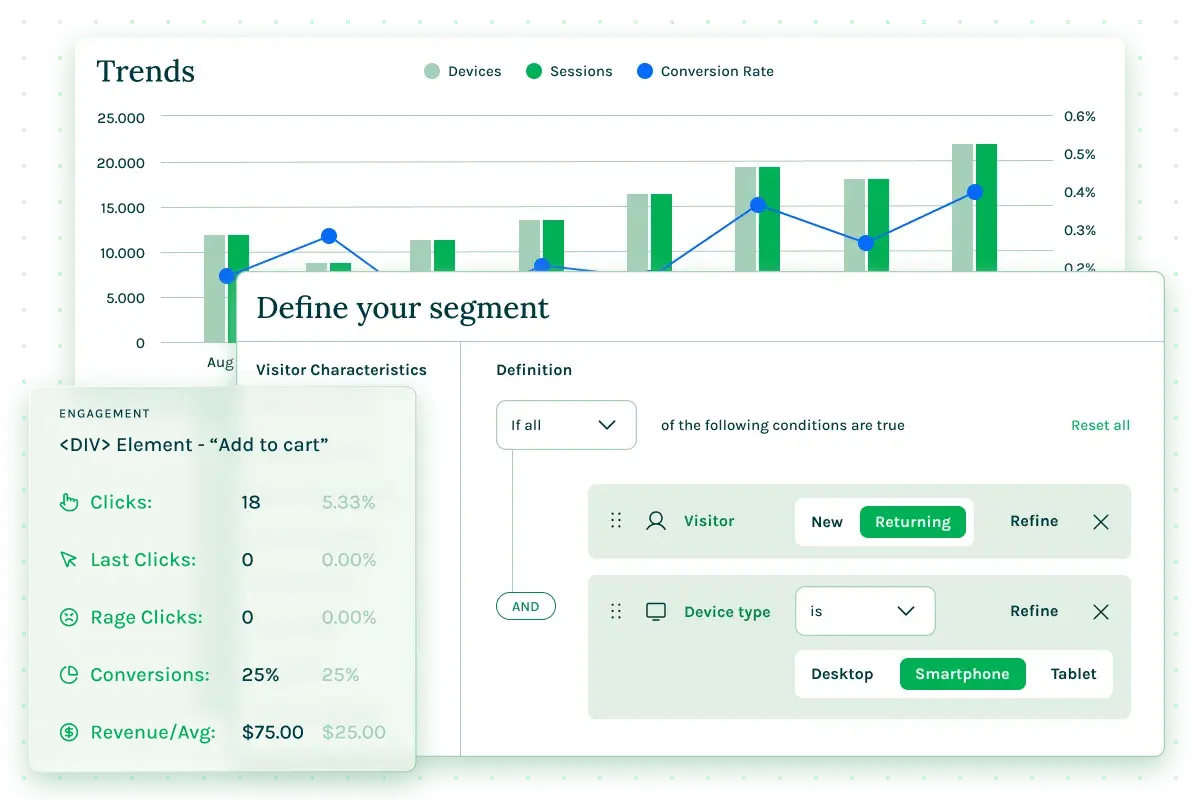
- Build dashboards by asking: Describe what you want to see in plain language, and let AI assemble the dashboard for you.
AI SEARCH VISIBILITY
Understand how AI sees your brand.
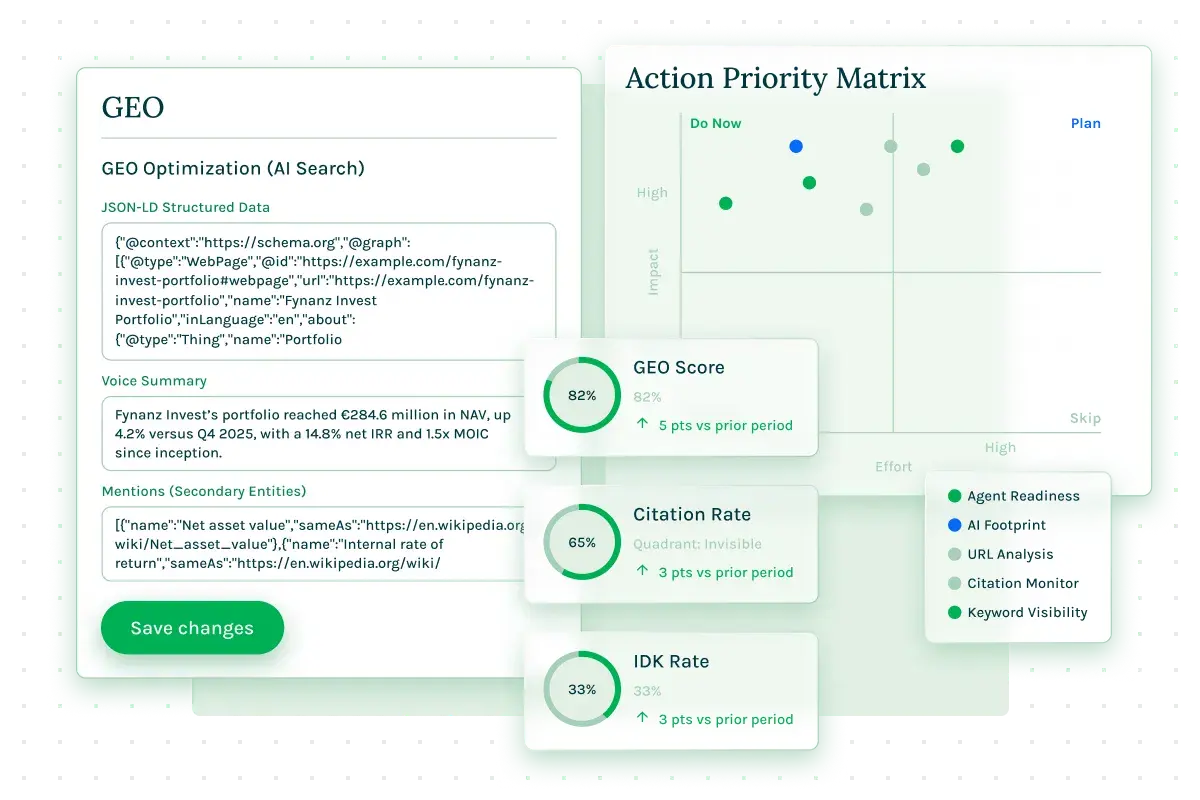
AI engines now answer on your behalf. Magnolia Answers powered by ai12z helps you understand how they represent your brand, before a customer ever asks.
- AI citation tracking: See how often AI engines and answer surfaces reference your brand and content.
- Site readability for AI agents: Understand how easily AI systems can read and cite your pages.
- Weakest-page detection: Pinpoint the pages holding back your AI visibility, so you know what to fix first.
BEHAVIORAL ANALYTICS
Prove every update. Protect every conversion.
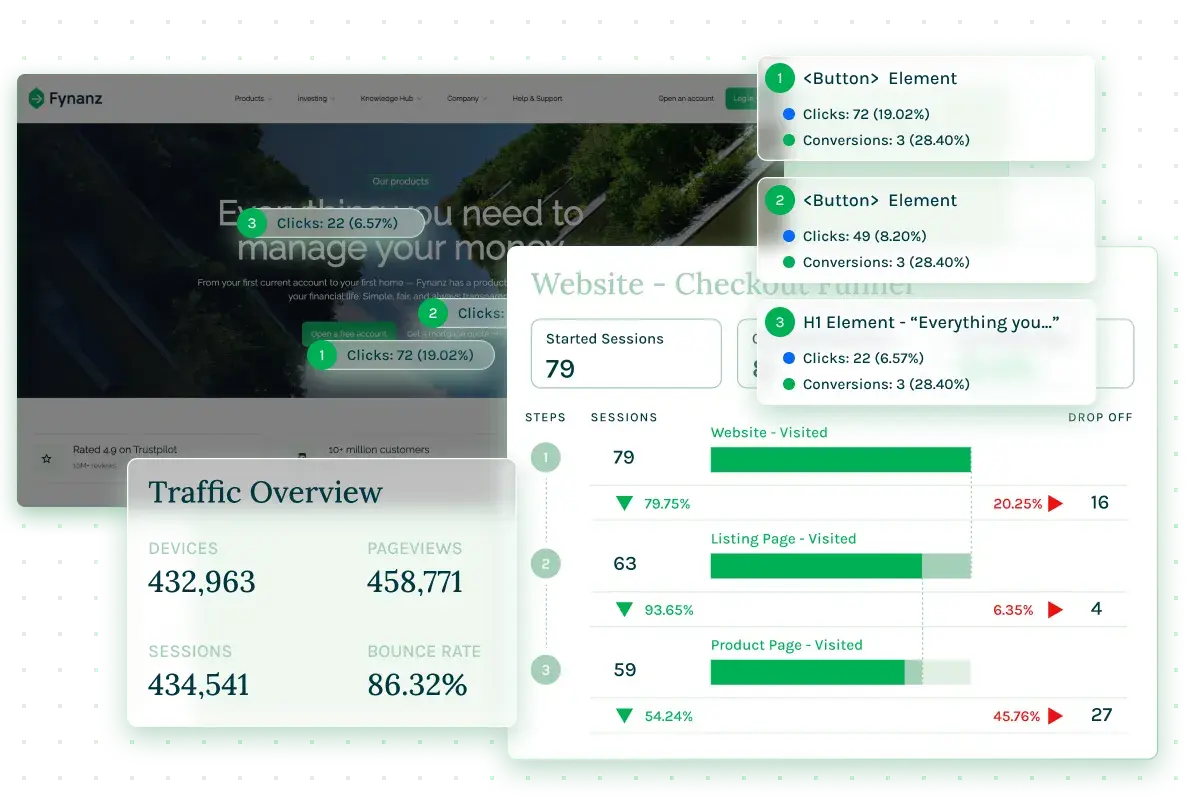
Stop guessing how your content performs. Magnolia Conversions, powered by Insightech, embeds real-time behavioral intelligence into your workflow, linking content decisions to revenue.
- Revenue optimization: Streamline journeys with heatmaps and pathing. Validate design updates with behavior to keep conversions growing.
- Conversion loss prevention: See why users drop off. Flag technical friction, measure revenue impact, and watch replays to prioritize fixes.
- Collaborative data: Empower the whole team. Share reports, heatmaps, and session replays via simple links to align everyone around user insights.
CASE STUDIES
Stories of analytics and success


Connected Capabilities
A complete platform for global growth
See how your team can evolve its capabilities.
.69ee8887c3020fd0e75f08f2ba624389.webp)
.f56f821ae315e5bdc2992fc375142469.webp)
.6b279e75197c980bc3185045a6d4f47b.webp)
FAQs